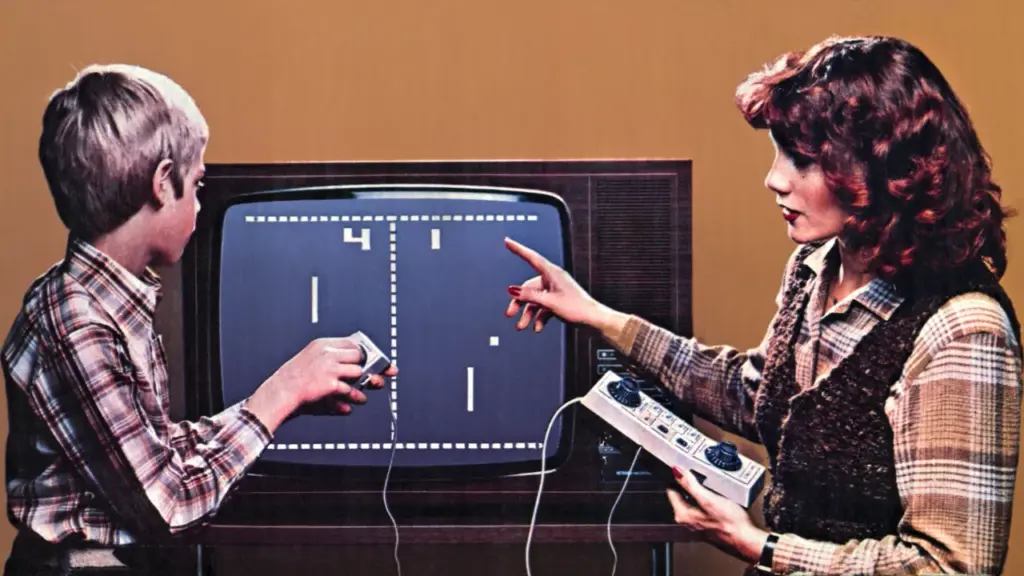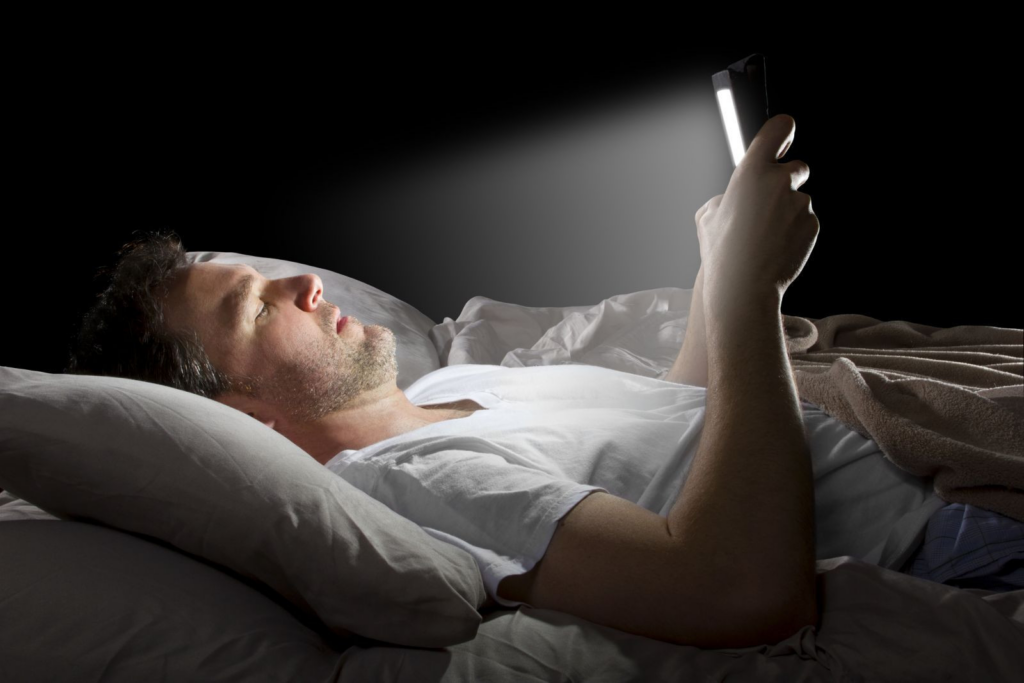
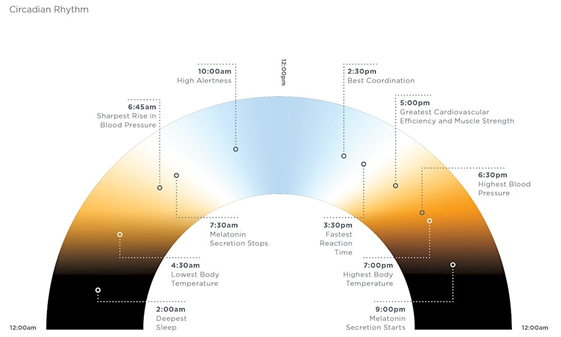
Artificial light, especially from lightbulbs and smartphones, disrupts our sleep cycle and suppresses the production of melatonin. The aspects that disturb us are primarily brightness, temperature and prolonged use during evening hours. This happens because the sun naturally emits intense blue light during peak hours and as smart devices mimic these conditions, our mood is boosted and our body becomes alert.
Calm tells us that a common best-practice for better sleep quality is avoiding screens 1–2 hours before bed, but if this is not possible, there are other solutions:
- Using dark mode, to shift screen colors to warmer tones (yellow/orange)
- Using blue-blocking glasses, to filter out blue lights
- Lowering brightness
- Choosing calm, low-stimulation content
- Exposing yourself to lots of bright light during the day, which improves mood and ability to sleep (Harvard Health Publishing)
- Using dim, indirect lighting in your room, so your eyes are not adjusting between two extremes.
- Creating rituals to wind down, like sipping tea, stretching gently, dimming lights or playing ambient sounds or calming music
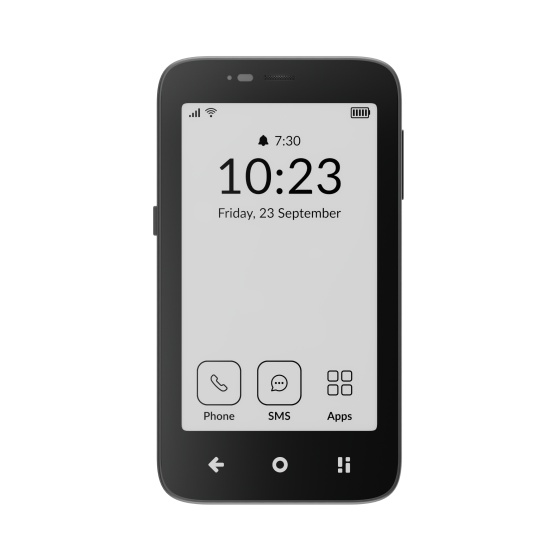
The less your nervous system has to process, the easier it is to relax. Therefore, when using your phone in the evening, you should:
- Avoid fast-cut editing, suspenseful storylines, or emotionally charged posts that can keep your brain alert long after putting down the phone
- Avoid answering e-mails, playing games or watching engaging shows
- Consume slower, more predictable content, like a familiar show or nature documentaries
- Avoid social media or curate your feed towards slower content
- Use apps that guide meditation, breathing, or visualization
- Listen to white noise, gentle music, or ASMR, with the “Do Not Disturb” mode on and the phone slightly out of reach
- If you doom scroll, set a timer, a sleep reminder or keep the phone away from you when you are ready to sleep
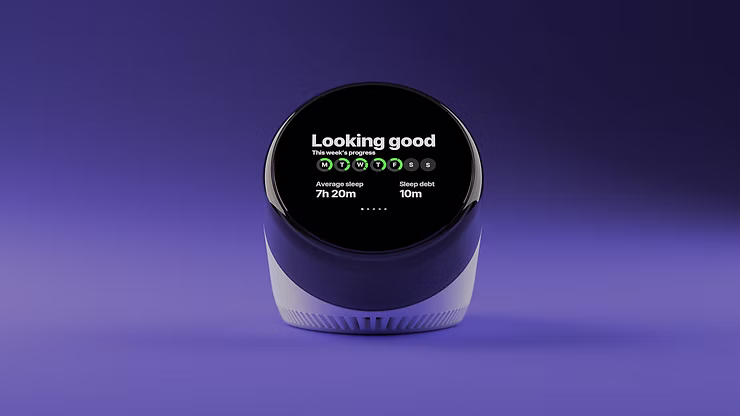
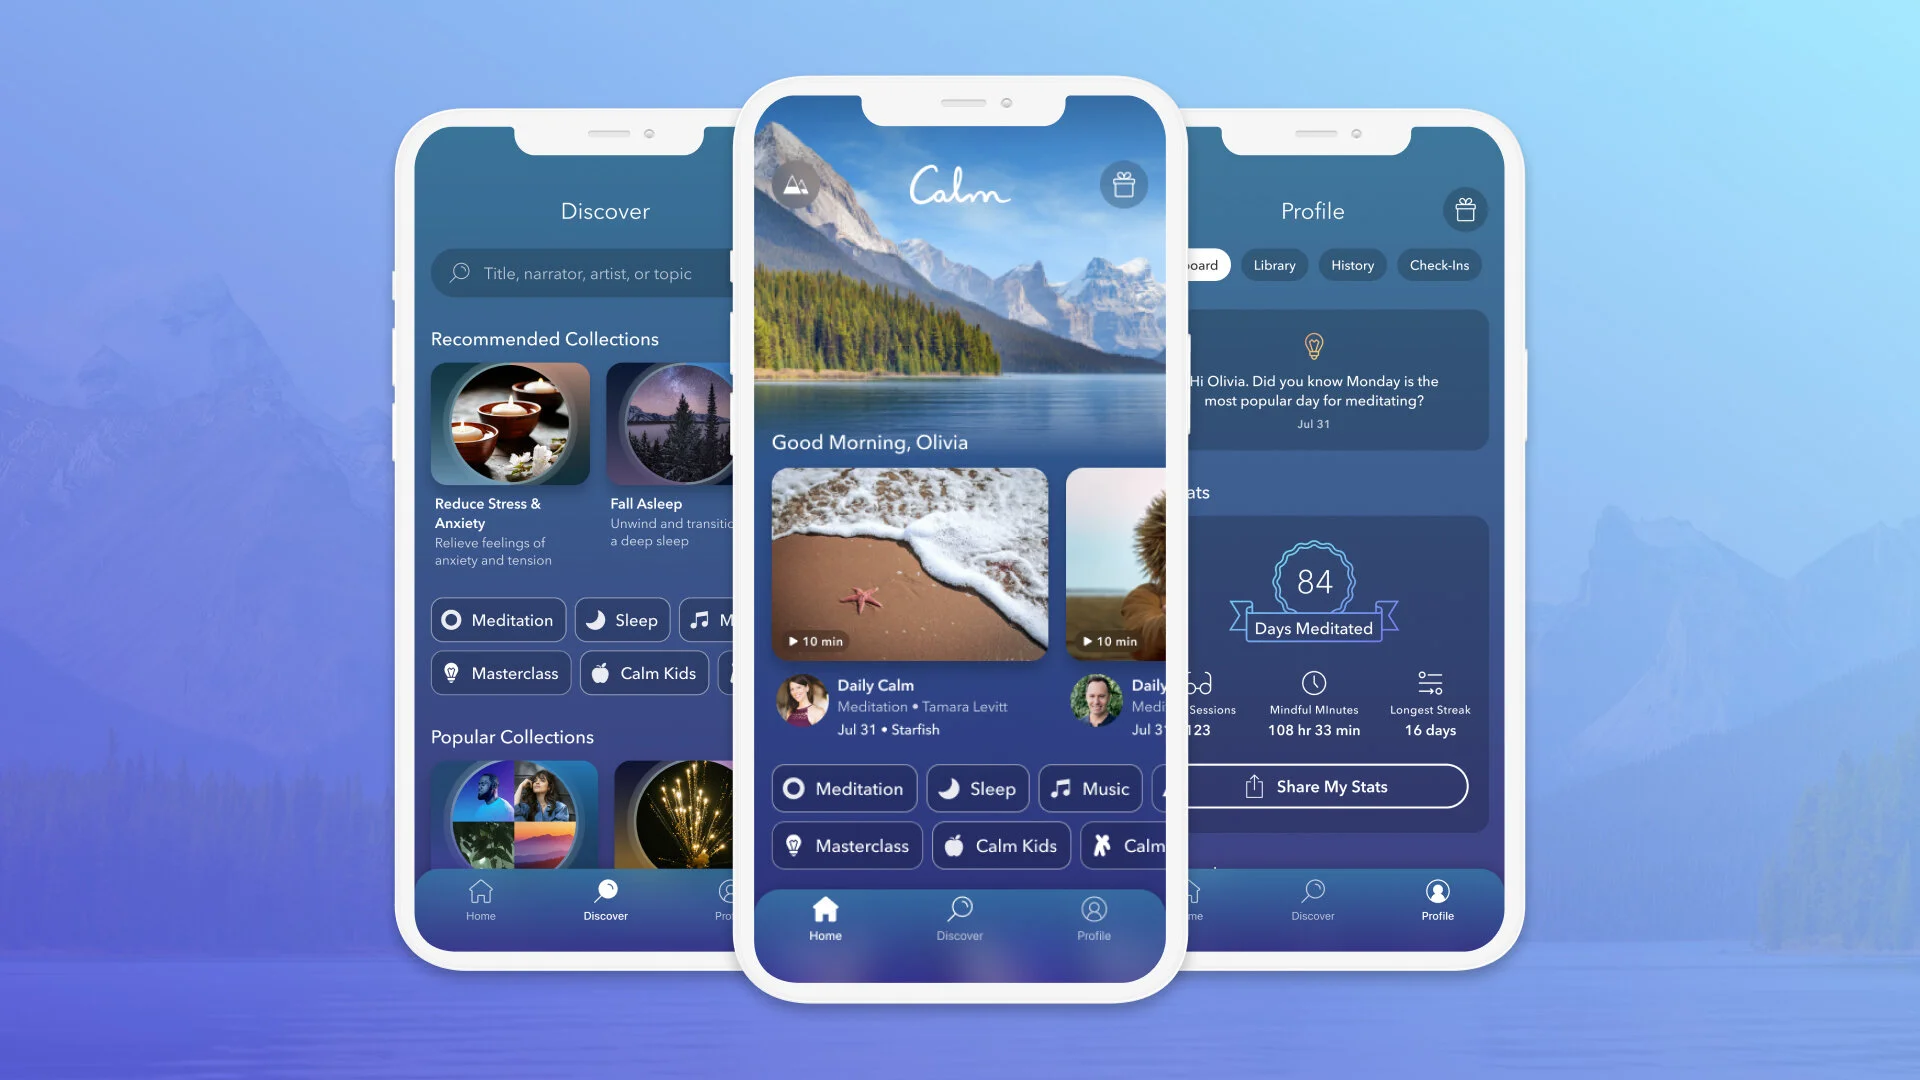
Calm is an app with bedtime stories, guided meditations, relaxing music, soundscapes and the function to track your sleep.
According to Calm, different light colours can affect the sleep cycle differently:
- Blue light helps you stay focused but wakes you up in the evening
- White light supports alert and clarity
- Yellow and amber light mimics sunset colours and relax the body, telling it to wind down
- Red light is the least likely to interfere with sleep thanks to its long wavelengths

A polysomnographic (PSG) and electroencephalographic (EEG) study published in Sleep Medicine Volume 14, Supplement 1 showed that sleeping with a bedside light on not only causes change in sleep quality , but also has a persistent effect on brain oscillations.
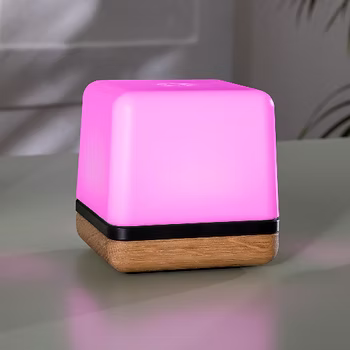
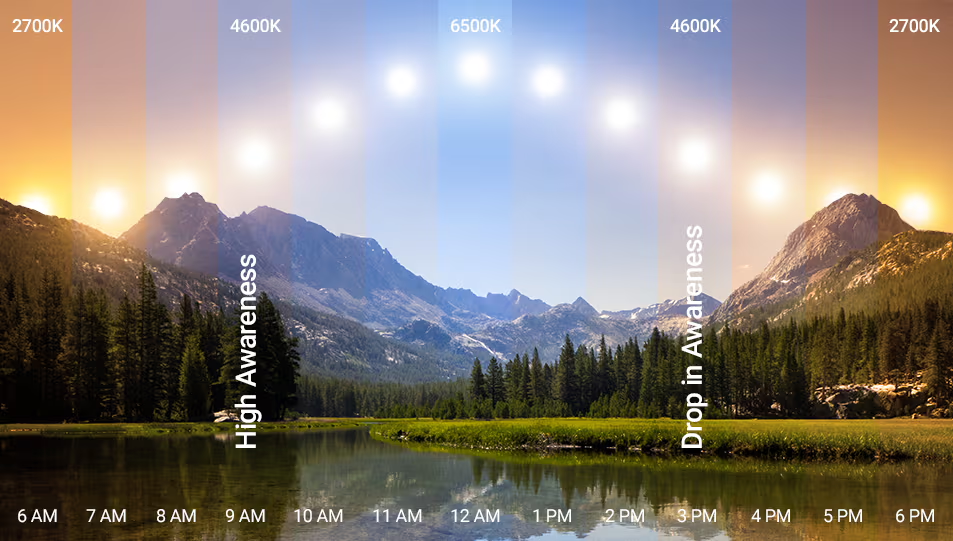
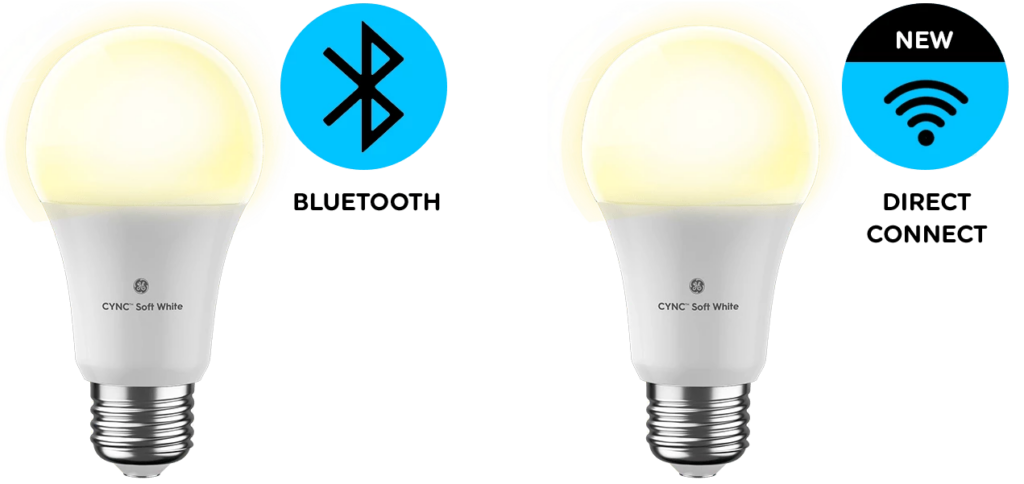
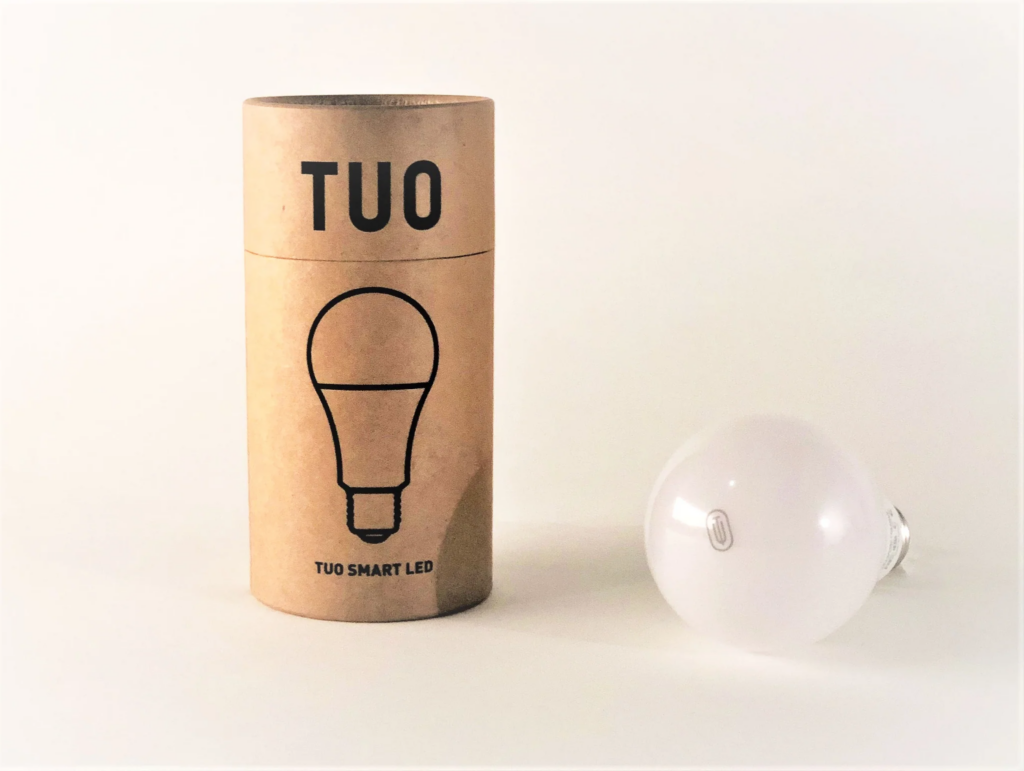
Many companies, such as Ge Lighting are designing Circadian Lighting products. According to their website, Circadian Lighting is a concept that can help support the internal biological clock and sleep. With light the human cycle can be synchronised with the natural cycle of the world. Circadian Lighting does not only improve health, but also reduces fatigue and improves productivity, concentration, cognitive health and physical and emotional wellness.
Circadian Lighting considers color temperature, time, duration, and angle of light. The methods used are intensity tuning, colour tuning and Correlated color temperature (CCT). Intensity tuning is a controlled dimming system that sets the light’s intensity to match the brightness of the sun. Colour tuning and correlated colour temperature match the light’s temperature to match the colour of the sun. Values range between 1000K and 10000K. The lower, the warmer and the higher, the cooler.
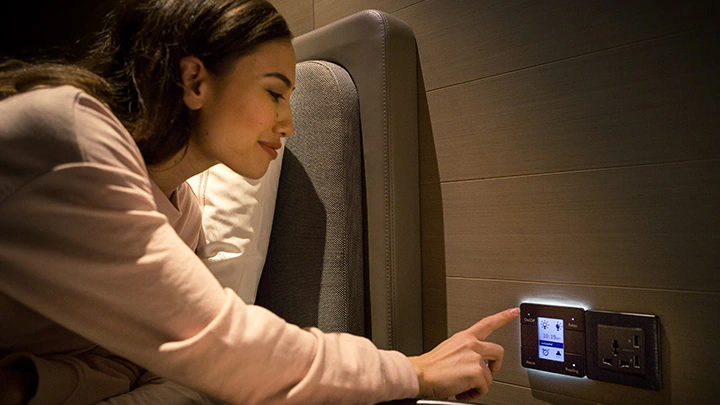
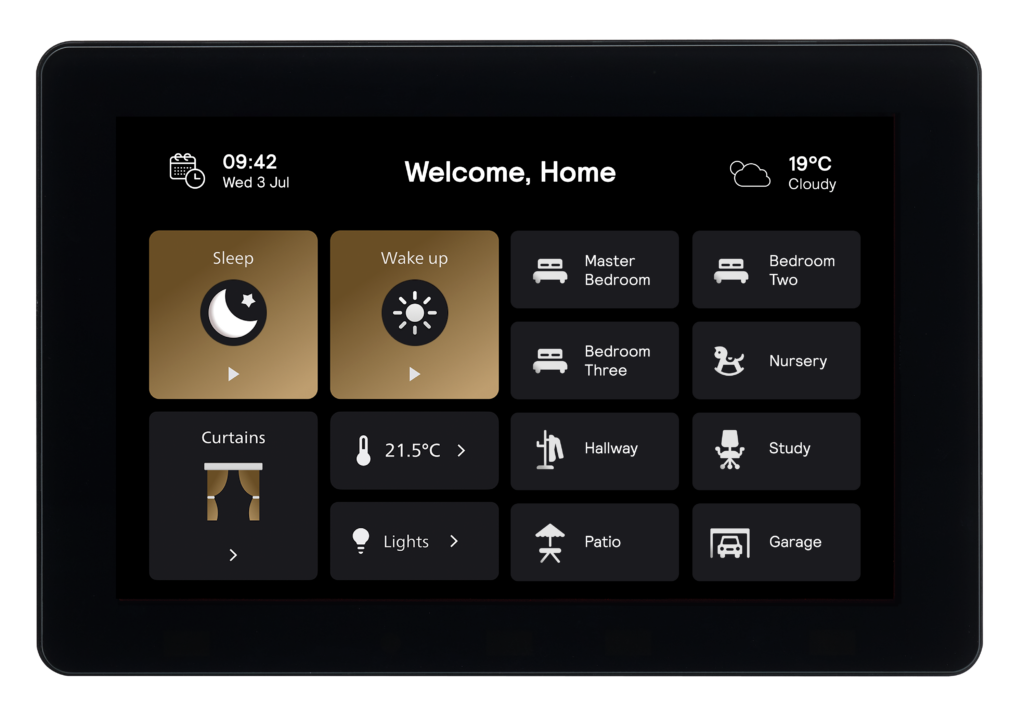
Below you can find some Circadian Lights. These products are connected to the Internet and allow a schedule and settings personalisation through an app or other interface.
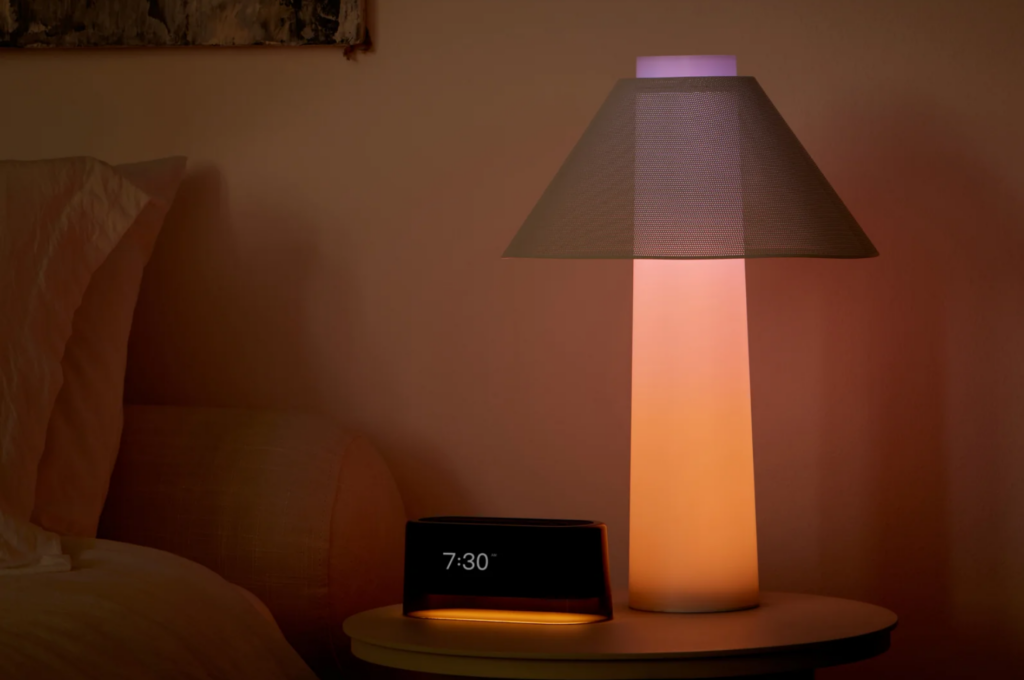
Philips has developed a lighting management platform called Dynalyte. It allows users to create different lighting scenes to suit a variety of tasks and occasions, schedule scenes according to sunrise and sunset, seasonal changes and and public holidays and also the function to group luminaires. To manage their space, users can choose between browser-based software and mobile apps. The system includes user profiles and access control.