D&R2 SED – Change and Impact 2/3

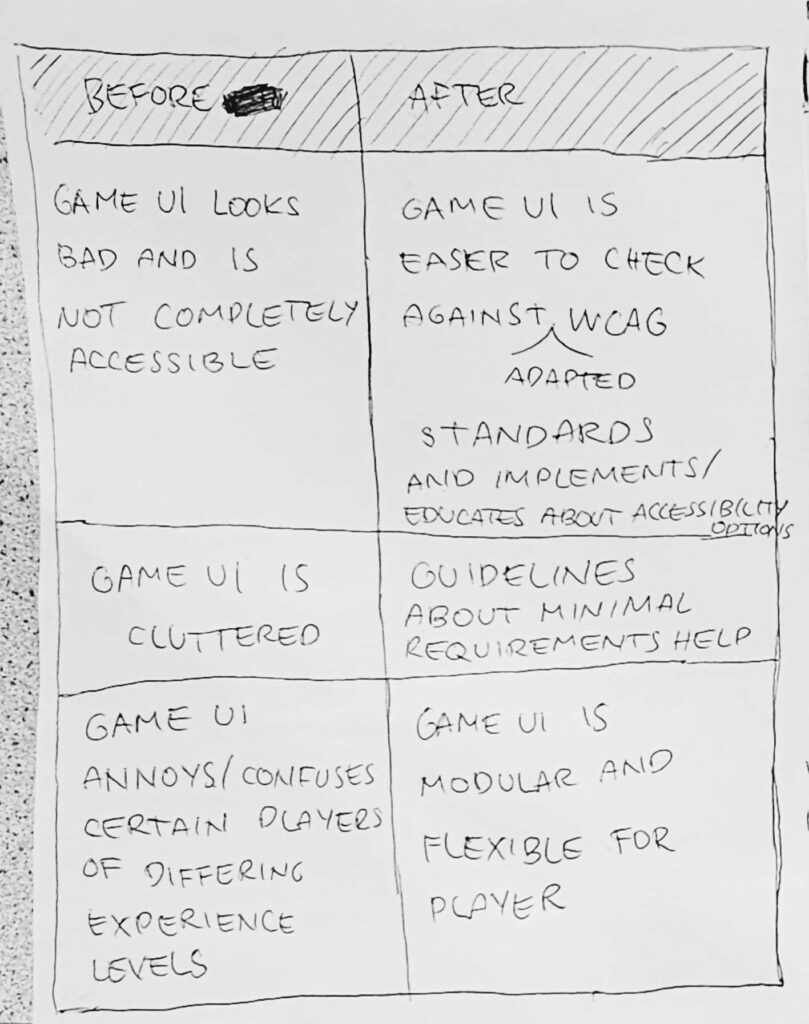
In the “before” scenario, Game UI is often static, cluttered, and not completely accessible. Design decisions are frequently made without a standardized framework, resulting in interfaces that annoy or confuse players of differing experience levels. These “standard” UIs look “bad” in the sense that they fail to meet the functional needs of everyone, leading to a disconnected and frustrating user experience.

In contrast, the “after” scenario highlights a shift toward a more scientific and flexible approach. By adapting and checking designs against WCAG (Web Content Accessibility Guidelines), the UI becomes a tool for education as well as interaction. The impact is a “Modular and Flexible” UI that uses minimal requirement guidelines to reduce clutter. This shift ensures the player is no longer fighting the interface but is instead empowered by a system that adapts to their specific level of experience and physical needs.
D&R2 SED – System Map 1/3

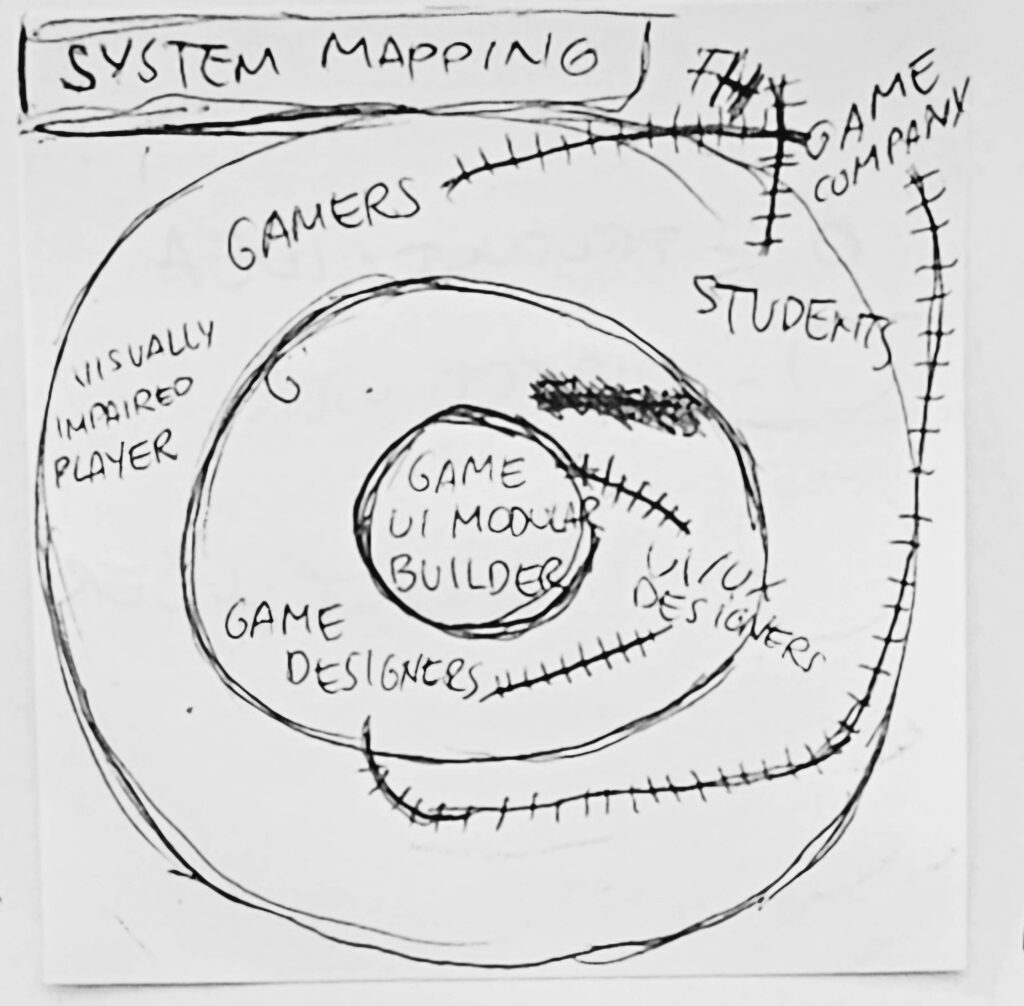
At the center of the system is the Game UI Modular Builder. This is the core tool or framework designed to bridge the gap between static design and player needs. Surrounding this center are the primary creators—UI/UX Designers and Game Designers—who directly build and implement the interface elements. The next layer includes the active users: Gamers, Students, and Visually Impaired Players, whose diverse needs and feedback loops drive the modularity of the system. On the outermost edge, the Game Company acts as the broader stakeholder, providing the professional and institutional context that allows the system to exist.

The map highlights the “stitched” connections between these groups, showing that a modular builder is not just a piece of software, but a meeting point for professional design and lived user experience. It reveals that accessible UI is a collaborative ecosystem where the designer’s tools must directly respond to the player’s specific barriers.

#1. The impact of generative models on data driven narratives. A quick overview

After starting with a giant question mark about the role played by AI nowadays in the field of data visualization, I decided to start with a literature review to narrow down and frame better on which topic/s to focus. So I have decided to investigate better how LLMs and generative models intervene in data driven storytelling (meant as turning data into easy-to-read and easy-to-understand stories that help turning insights into action).

A systematic review regarding telling stories with data deeply guided my curiosity and focus on the topic of human intentionality. In addition, many papers were also questioning the modern role of the author in the creative process. I want to understand better where the author exactly stands today and how empathy and human intention, that are not entirely replicable by machines, fit in a world dominated by algorithmic storytelling. Therefore, I am exploring the co construction of meaning to observe how humans and algorithms might merge to build these new narratives.

As my literature review expanded, several critical points have emerged. I’d like to explore how algorithm suggestions might perpetuate a structural bias compared to a possible unintentionally “human manipulation”. It is also crucial to question whether relying on automated micro narratives is always the right choice when considering a diverse user base. To conclude (as if this was not already enough qeustions) I plan to explore the sociological aspect of the epistemic control, understanding to whom may it belong.

But for now, let’s keep the focus on just the creative process adopted to create a narrative starting from data and see how the data community behave when involving AI!

Inclusion and Accessibility

Design&Research 2 with Katerina Sedlackova

The third step in analising my project’s users was inclusion and accessibility. This happened in two phases, where I asked myself some questions.

For whom is the experience accessible? What is needed for the full experience?

  • A mobile phone with GPS
  • An Internet connection
  • Vision, actually also a good eyesight
  • Basic knowledge about light pollution

What are the barriers? How do we make the product accessible?

  • Vision: for blind people, there could be an audio guide working with GPS that describes what is visible in the sky; the phone camera pointed at the sky could help reporting data about light pollution;
  • Myopia: the experience should be AR, so if someone does not see well from afar, they can still see the stars on their phone thanks to the camera; the phone camera could help reporting data about light pollution;
  • Hyperopia: When using AR and reading words on the screen, there should be an option to zoom in; text size changes and speech-to-text features should be supported;
  • Internet connection: there should be an option to save a report even when you are offline, then the data is sent as soon as Internet connection is reestablished; written feedback and progress about this should be shown;
  • Basic knowledge about light pollution: the app could have brief explanations or information buttons beside some sections, as well as explanations about the issue and its importance in general;

Discovering influence and impact

Design&Research 2 with Katerina Sedlackova

The second step to visualise who is involved in my project was to create various “before” and “after” scenarios, which I summarise below.

Before

  1. Scientists wonder about light pollution in a certain area
  2. Sleep experts wonder if there is a correlation between some sleep patterns and the light pollution of a certain area
  3. The government or the European Union do not direct their funds towards this problem due to lack of awareness
  4. Citizens feel helpless in front of environmental issues

After

  1. Nature lovers submit data about the night sky during their outdoor adventures
  2. Thanks to data collected by the Globe at Night Project, universities can research correlation between some sleep patterns and the light pollution of a certain area
  3. Thanks to collected data and awareness, young people concerned about the environment raise their voice and draw the institutions’ attention
  4. Thanks to a easy reporting feature, citizens can help scientists with small actions

System map

Design&Research 2 with Katerina Sedlackova

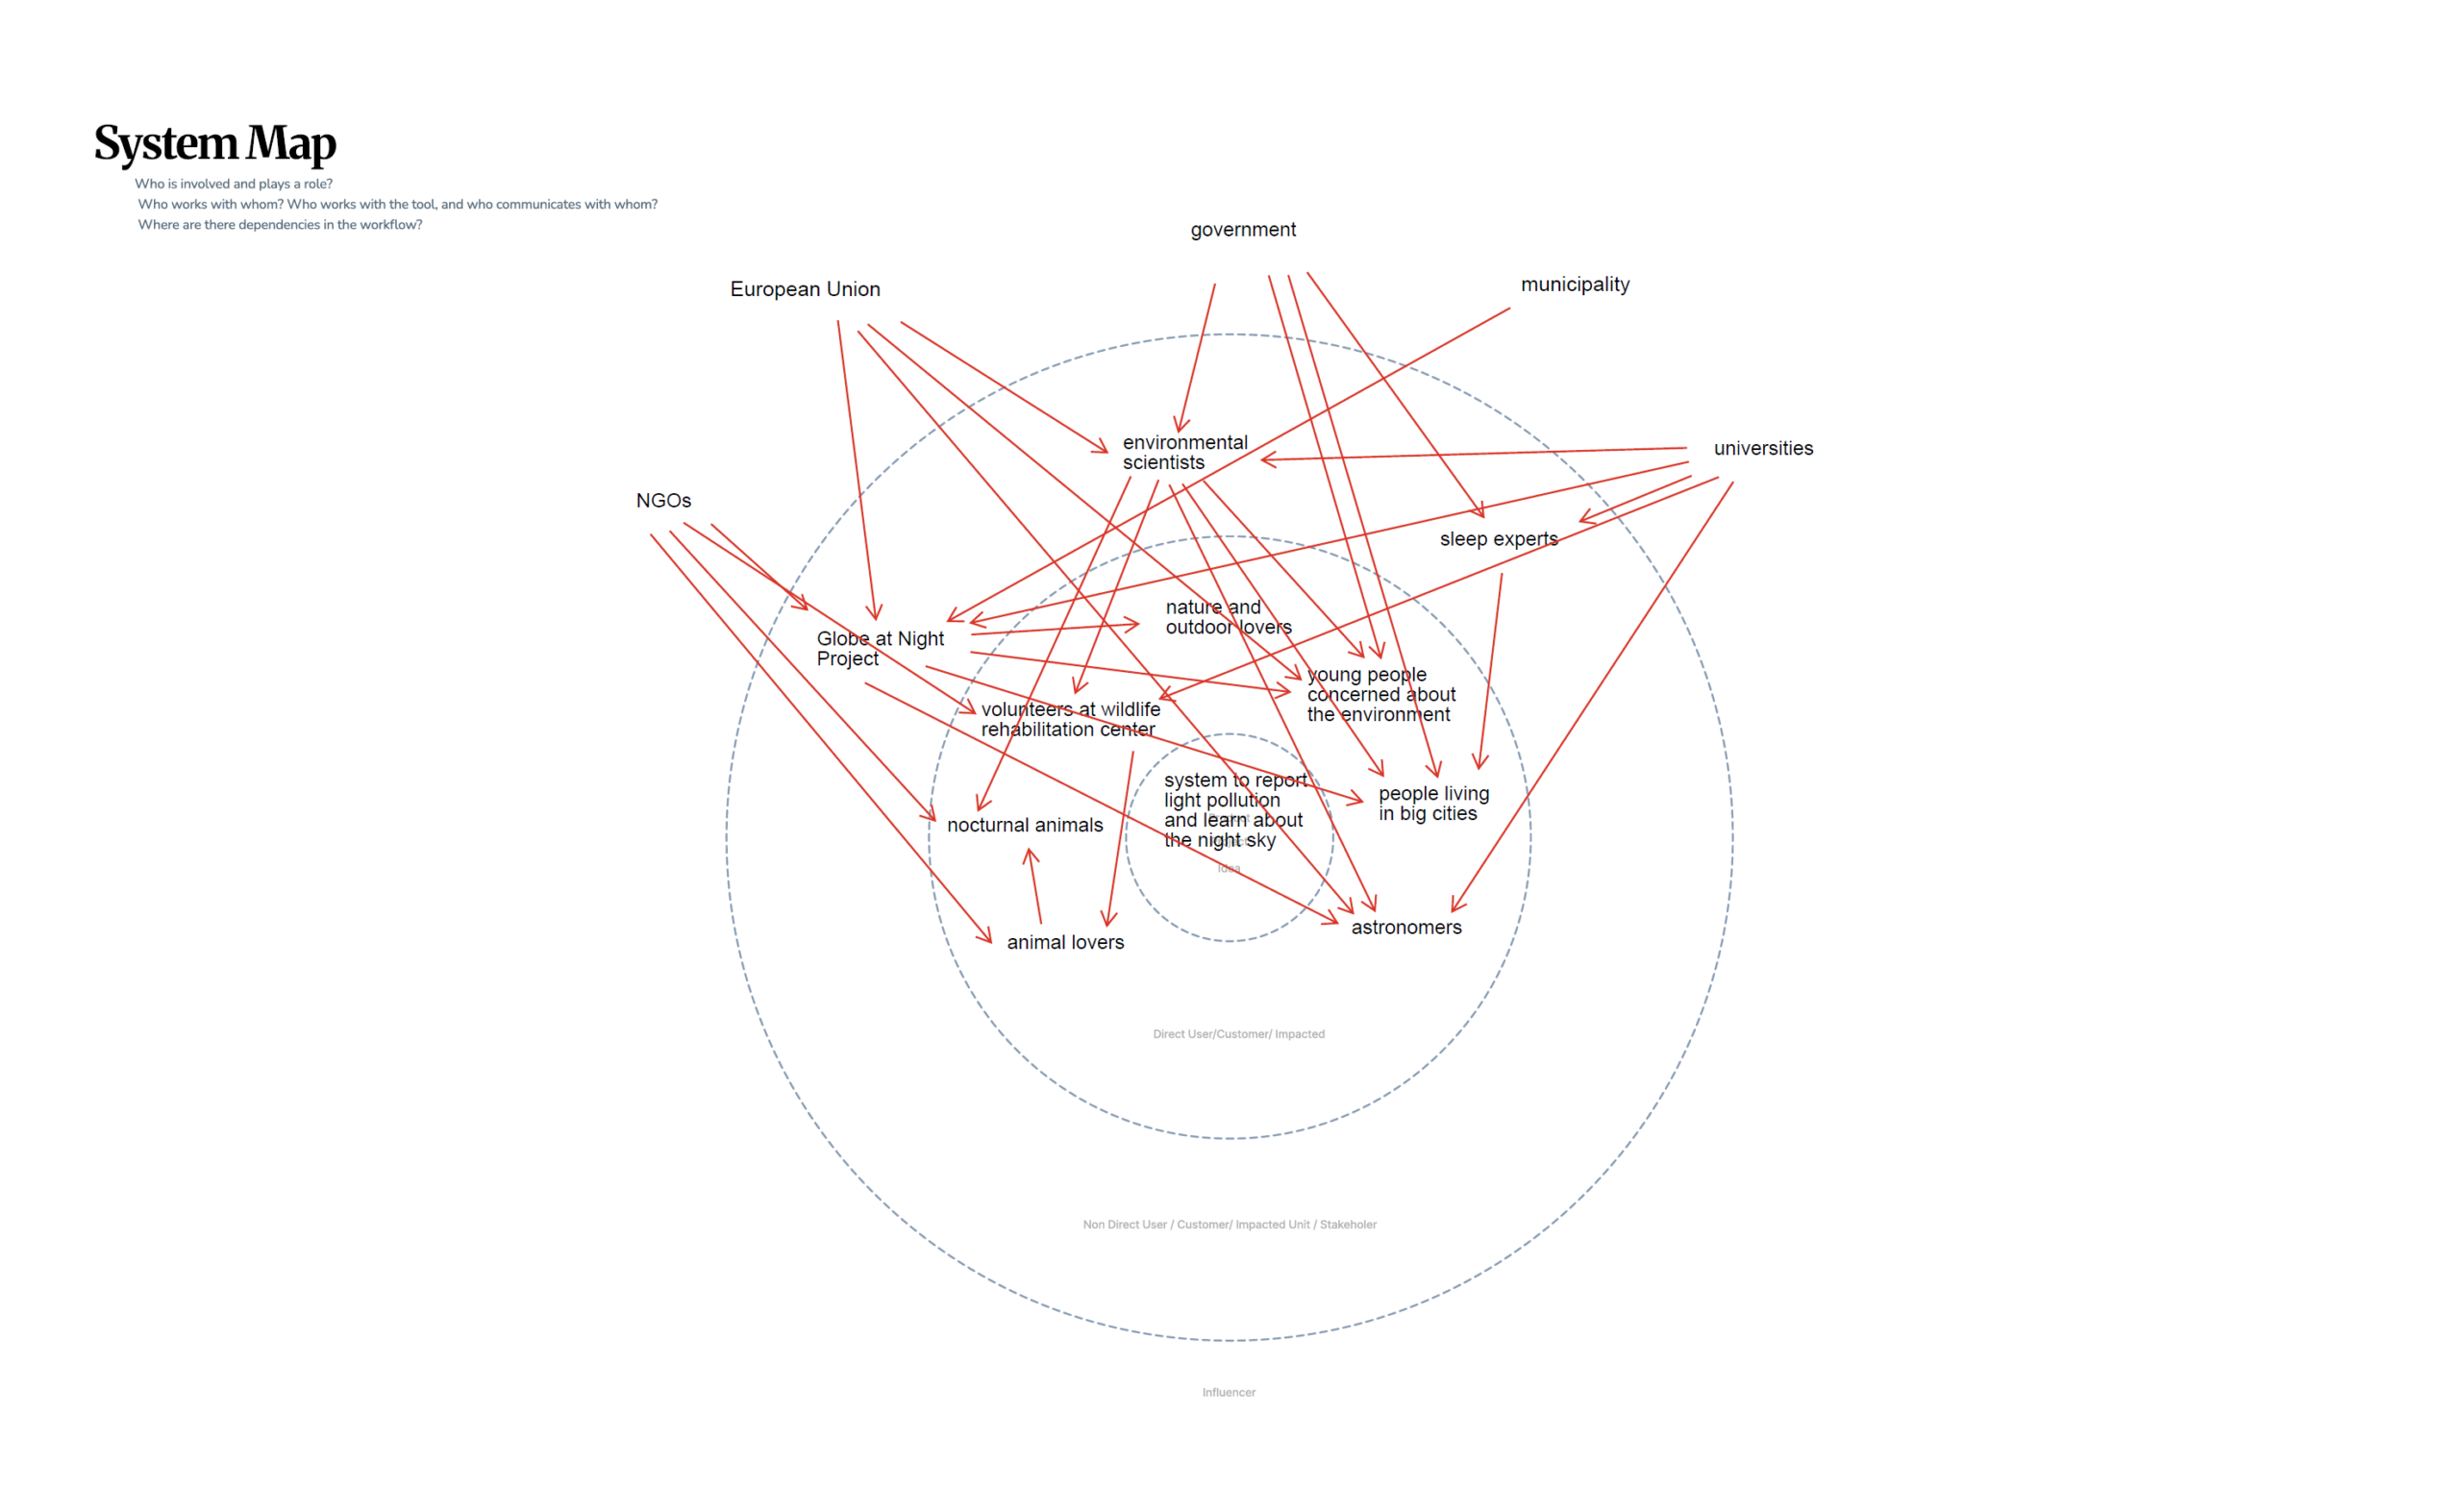
For my idea of a system to report light pollution and learn about the night sky I created a system map. It is used to visalise direct users, indirect users and influencers of the project. After filling out the map, I drew connections between the people and institutions involved.

★2 Design Research – From Project to Product

Discovered Change and Impact

Next, I started thinking about what my method or tool would actually improve. I believe that many family members get frustrated because they are always the first point of support when it comes to technology, constantly having to explain or fix things for older relatives.

With my method or tool, elderly users would be encouraged to first try and find a solution on their own instead of immediately relying on someone else. This could really improve family dynamics, as it allows people to spend more quality time together instead of using that time to troubleshoot devices.

I also thought about how many older adults lack the means to independently access and explore information. This can lead to an incomplete or sometimes biased understanding of current events.

With my tool or method, elderly users would be able to access information more confidently and see a bigger picture, helping them form their own opinions and make more informed decisions about current topics.

Another point is that many older adults have limited ways to stay connected with family or peers beyond phone calls. They often struggle to access or use tools like group chats, which makes it harder to stay involved in everyday communication.

With my tool or method, older adults would be able to understand and use digital tools more easily, allowing them to stay connected, take part in conversations and feel more included in their social circles.