In the last blog, I discussed the functioning and features of the audio pipeline, which was built using plugdata. We were able to collect pitch and loudness data from our audio stream and were attempting to send it to TouchDesigner via OSC. However, the connection was not successful. I had to redo the patch and will share my insights and methodology on fixing the issues.
I had to repackage the data streams into an [oscformat] object and then prepend them into a list before moving on to the next step, which was to replace the [oscsend] object I had previously used with a [netsend] object containing the arguments ‘-u’ and ‘-b’. This sends data through the UDP protocol. It was configured to send messages to localhost on the port I set at 3000.
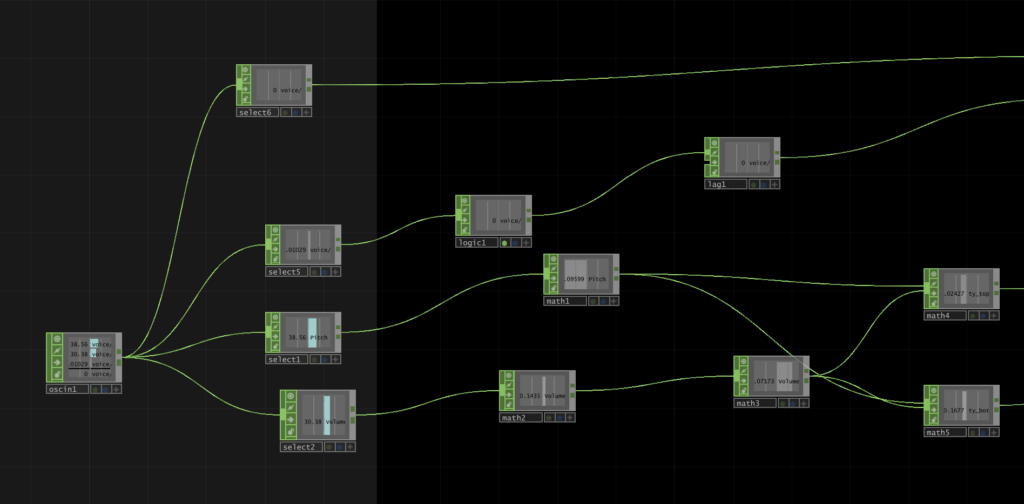
In TouchDesigner, I used the ‘OSC In CHOP’ to collect the information sent from plugdata. I had a small monitor indicating the variations in values inside the CHOP, this meant that the data connection was successful. I was now ready to build the audio reactive visualizer. I wanted to see how the OSC data affected the visual output. So, I tried testing it out with a project I found through the Youtube channel supermarket sallad. It was a spherical visualizer which simulated various particles and noise. It was a visually appealing piece, I was able to play around with the lighting along with particles and found it really interesting. I wanted to implement a similar visual model with particle clouds for my project but later decided to go with an alternate approach.
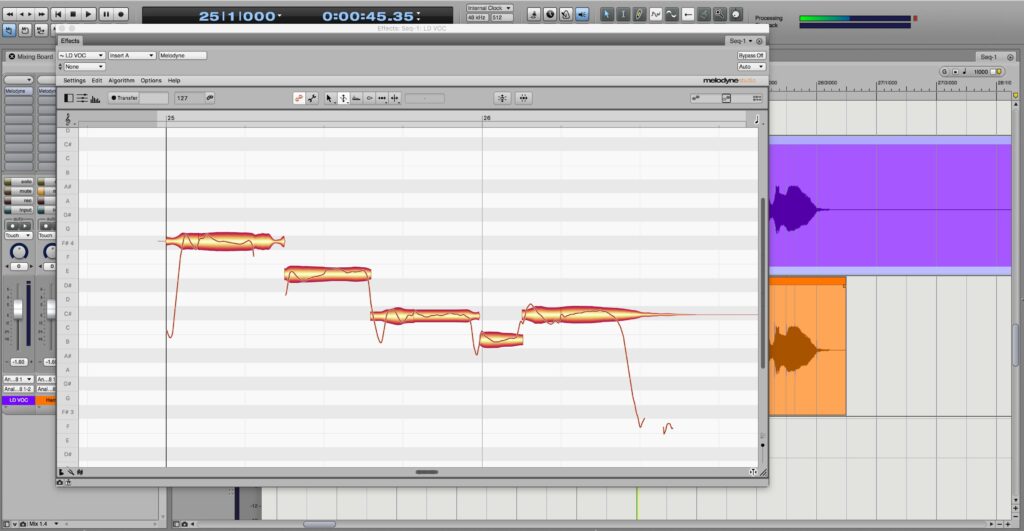
My initial concept was to build a 3D waveform model for the visualizer, but it was proving to be quite difficult. After consulting with my mentor, he suggested that I work on a simpler model and if needed modify it later on. I was now trying to think and come up with ideas for new visualizer styles which can also be easily understood by a user. So, I kept searching and eventually got curious with the waveform structures found in pitch shifting plugins like Melodyne. It seemed like an interesting model as you could tell the variation in pitch based on different positions along the y-axis. This also made me move away from mapping pitches to colour (Camelot wheel) as I had described earlier.
I would still have to consider a couple of things to see if this model works for me. What kind of elements (CHOPs, SOPs, TOPs) would I require to build this model and how accurately can I display the concept I had initially planned? Some of these will be answered in my next blog. Until then!