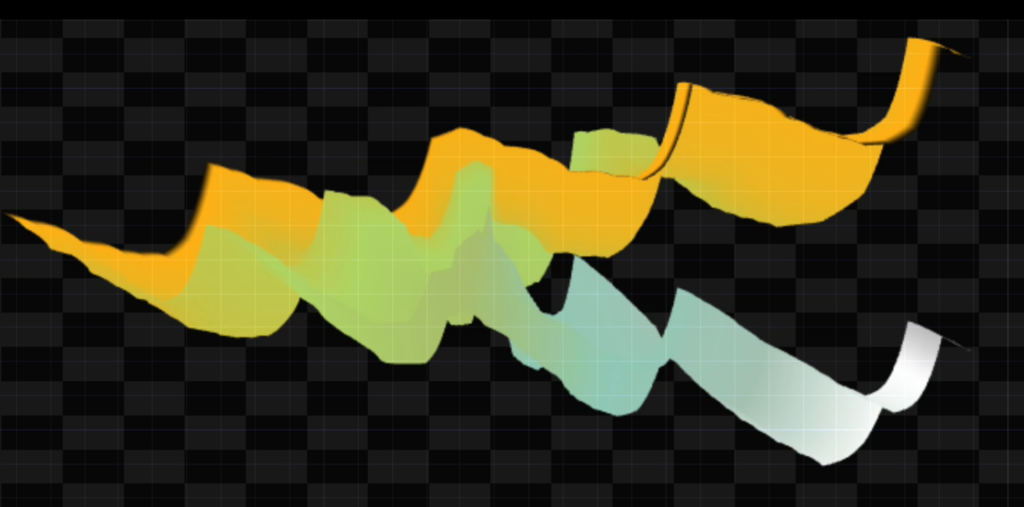
Building the visualizer was the most challenging part of the project so far. I ran into a lot of trouble fixing the waveform as it kept changing drastically through each iteration. In this post, I will give a breakdown of the workflow and briefly discuss the multiple errors I faced along the way.
I built the ribbon based visual system using multiple elements as I mentioned in the last blog, utilizing various combinations of multiple CHOPs (channel operators), TOPs (texture operators) and SOPs (surface operators) to get the output. I initially used an OSC In CHOP to collect the data on pitch and loudness. These data streams were then separated using a select CHOP and sent to a math CHOP to define the parameter ranges. This was a crucial step, as defining these ranges significantly altered the visualizer’s behaviour. I finally settled on a ‘from range’ of 40 to 100 and a ‘to range’ of 0 to 4 for the pitch. The loudness, meanwhile, has a ‘from range’ of 25 to 100 and the ‘to range’ of 0 to 2.
I had to create more math CHOPs to carry out more calculations. I split the loudness in half and combined it with the pitch values through the operation of addition and subtraction. This was done to define the upper and lower limit of the waveform, which were called ‘ty_top’ and ‘ty_bottom’ respectively. After this series of math CHOPs I had to place a Trail CHOP to capture the history of the data, recreating the continuous stream of data at the given timeframe. This was followed by the pattern CHOP, which served as data for the x-axis. The pattern chop was then sent through a math chop and merged with the individual channels (ty_top and ty_bottom). Once this was done, we converted the CHOP to SOP for adding surfaces and textures. Finally, the SOP was placed into a Geometry COMP then a camera TOP and a render TOP were added to the end of the signal chain to generate the final visual output.
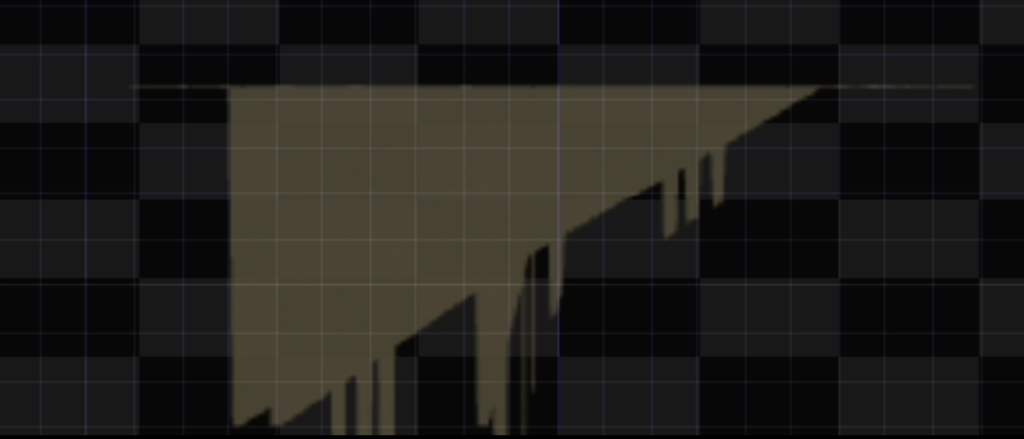
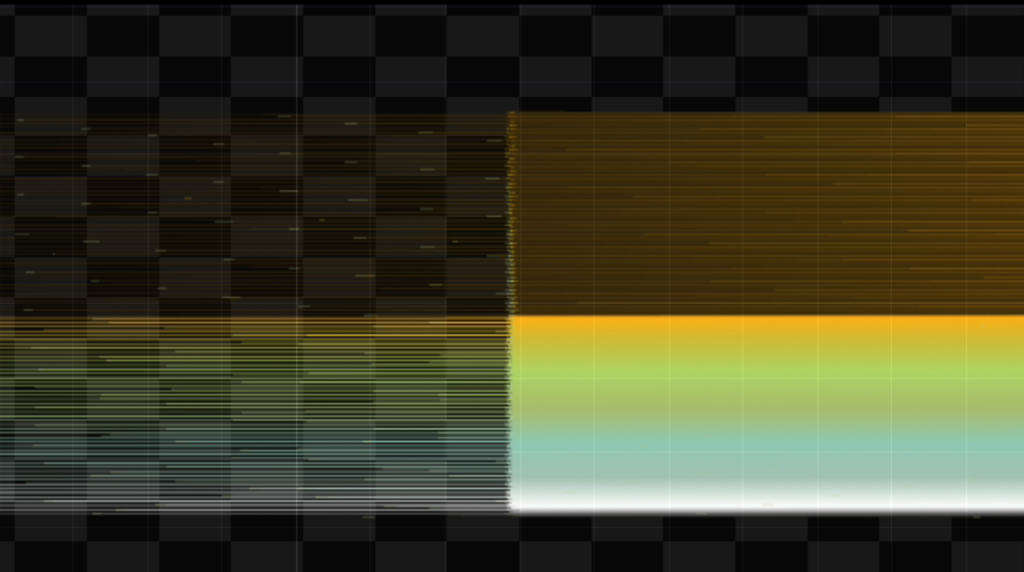
This basically makes up the entire visual build, but there were a lot of errors that occurred along the way. The first reoccuring issue was the appearance of a static line despite signals being received through OSC. Another visual bug was these sharp, triangular shapes that kept being pushed from the center, it looked very confusing. I also had multiple scenarios where the signal did not rise along the y-axis with the variation in pitch. And at times, we also had signals literally break in two halfway through the visualizer. It became so bad I started a new visual project in Processing, as it felt more likely to give me the output I was expecting.
In the end, I am trying to achieve a functional model with a few additional features that help the visualizer feel more interactive and complete.