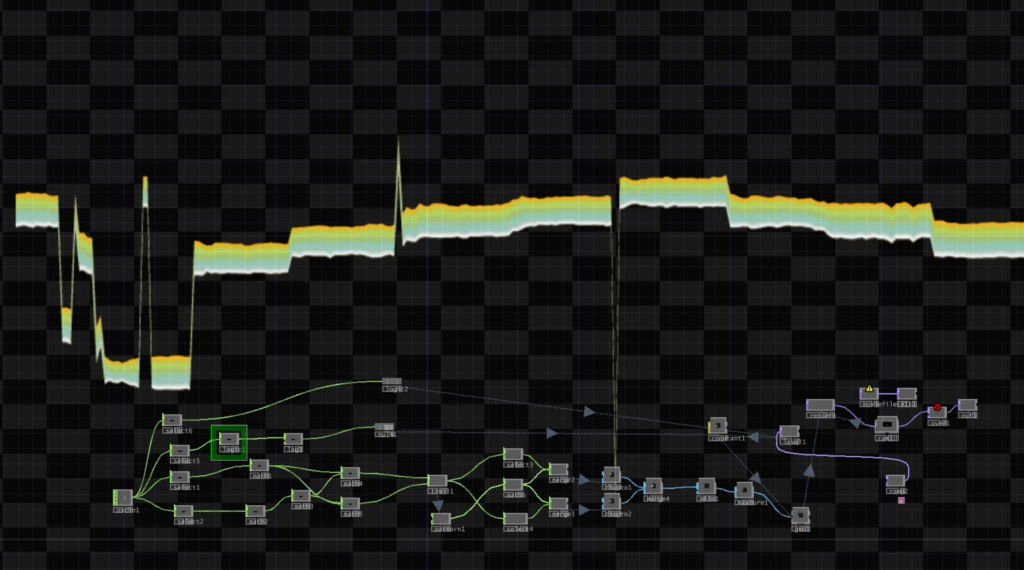
My prototype for this semester is finally complete. After much trial and error, I was able to build a visualizer that functions as per the user’s input and is represented in a model that is easily understandable to the user. The waveform morphs and reacts based on the user input and doesn’t break or alter its core geometry in the process, finally maintaining a smooth and fluid visual experience. There are still a few additional tweaks that can be done, but it’s somewhat functional at the moment, which means that I have met my primary goals for this semester.
Some additions include the audio feedback response, which acts as a monitor based on chords to determine the pitch accuracy of the user. This was done using the quality parameter in the sigmund object, a very useful tool for pitch tracking. The signal runs through a relational operator (>) and when the signal fulfills the condition (greater than 90%), the patch plays back a chord for the user from an oscillator based on their pitch quality. If the user is perfectly in pitch, it will play a pleasant major chord, while a slightly off-pitch input would trigger a more dissonant minor chord, providing immediate auditory feedback without the user needing to look at a screen.
Another addition is the waveform, which now features a visual activation response where the visualiser remains inactive or dark when there is little to no input signal. The colour in the waveform reappears when the user is speaking, and this is a vital visual feature to indicate that the signal is being successfully received from the user. By fading to dark during silence, the interface reduces visual fatigue and makes the interactive moments feel much more dynamic. This addition was done using the data from the quality argument in the sigmund object, which was mapped to a Logic CHOP in TouchDesigner to trigger the visual state changes seamlessly.
I also considered adding a few advanced audio analysis tools from a Python library to give users more speech information. What I had imagined was an algorithm which collects a live data feed and predicts the different groups of consonants present in the speech (fricatives, affricates, plosives, etc). You would see numbers fluctuating on screen showing the variations in frequency as well as the tonal quality. Unfortunately, I won’t have enough time to implement this into the prototype, and it would be considered as a feature to be added in the future.
In the final blog, I will share my overall experience building the prototype, reflect on the challenges, and give insights on what to look forward to in the upcoming semester.